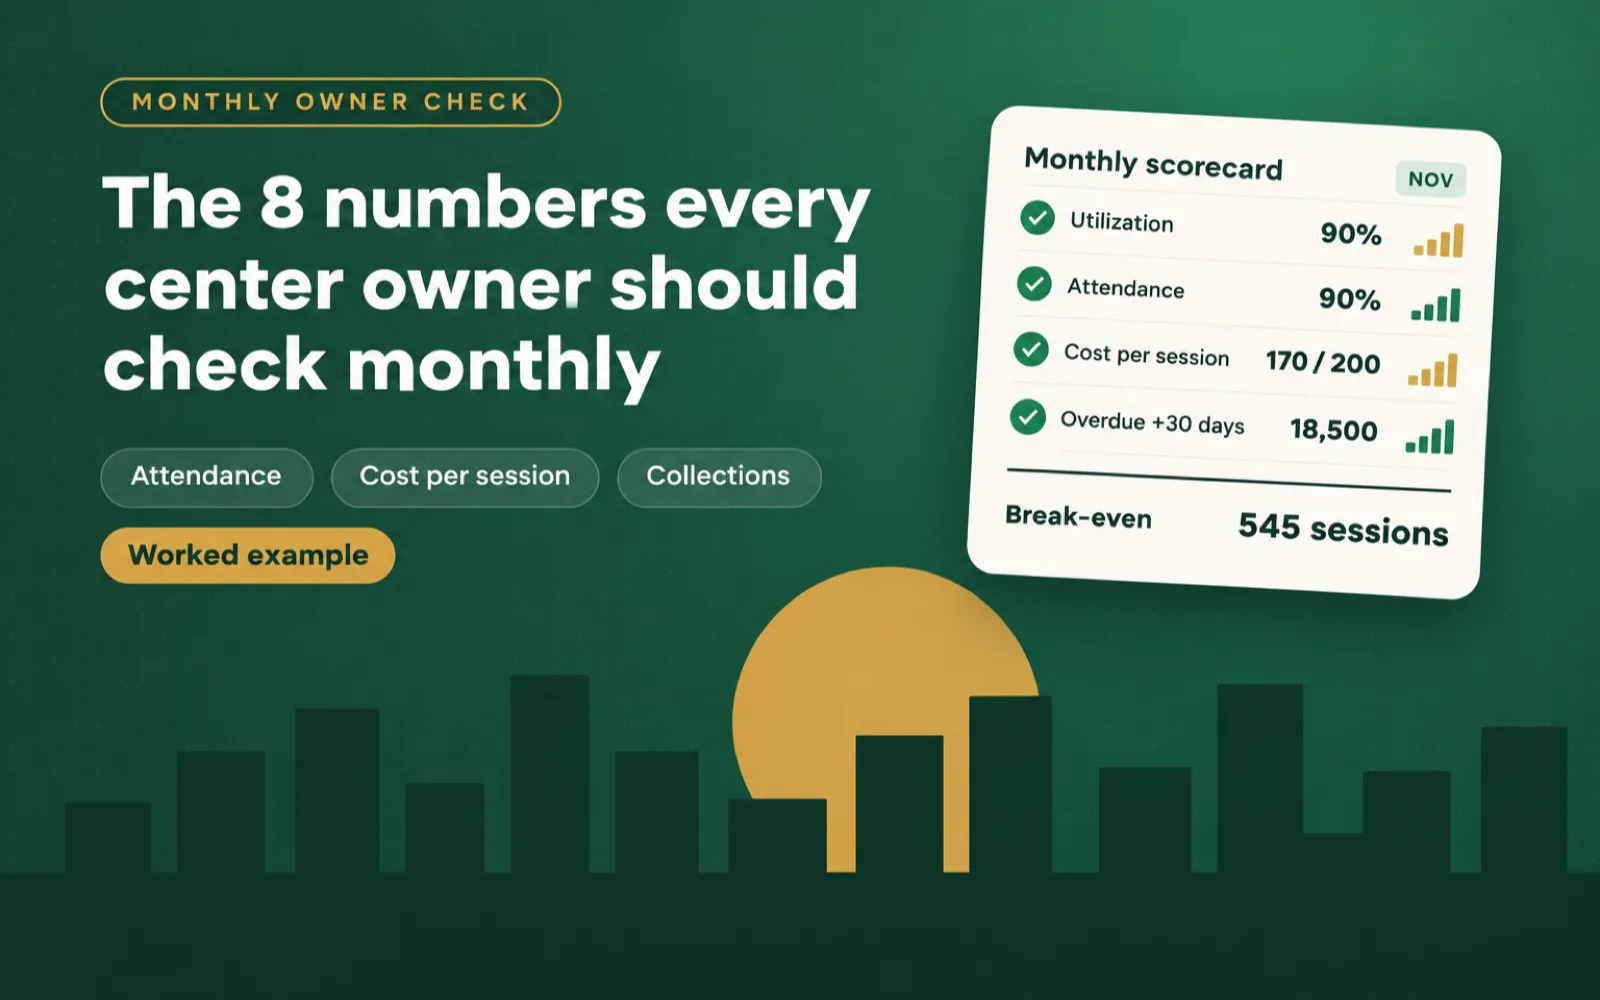
The short answer: a therapy center owner can judge the month from eight numbers: specialist utilization, attendance rate, cost per delivered session, collection rate, overdue balances, package renewal rate, net change in active children, and overdue documentation. Together they answer five questions: Is the schedule full? Do booked sessions actually happen? Does each session make money? Does that money arrive? Do families stay?
I built these eight from what I keep seeing when working with special needs, speech, and ABA centers. Most owners know their bank balance and roughly how busy the center feels. Few can say how many sessions were lost last month, or which families' packages run out next week. The numbers below fix that, and you can work out all of them in a spreadsheet in under an hour.
Why These 8 Numbers, and Why Monthly?
A therapy center sells specialist time. Every number here follows one session from the moment a slot exists to the moment its money is in the bank:
- A slot exists in a specialist's week (capacity).
- It gets booked (utilization).
- The child attends (attendance).
- The session costs the center something to deliver (cost per session).
- It is invoiced and paid (collection rate, overdue balances).
- The family renews and stays (package renewals, active children).
- The specialist documents it (overdue documentation).
A leak at any step costs money, and each step has a different fix. Revenue alone can't tell you which step is leaking.
Monthly is the right pace for the whole set, since it's long enough to smooth out a bad week and short enough to act before a quarter is lost. Three of them (packages ending soon, overdue balances, and overdue documentation) deserve a five-minute look every week as well.
A note on benchmarks: I won't give you "a good center has 85% attendance." I haven't found a reliable published benchmark for therapy centers in the Gulf, Egypt, or Jordan, and figures from other countries rest on different payment systems. Your best comparison is your own last three months, plus your break-even point (number 3 shows how to find it).
The Worked Example
To keep the formulas concrete, every section uses the same example center for one month. The numbers are illustrative, not benchmarks. Prices are in "units" so you can read them as riyals, dirhams, pounds, or dinars.
| Item | Example value |
|---|---|
| Specialists | 6 |
| Session slots per specialist per day | 6 |
| Working days in the month | 22 |
| Average session price | 200 |
| Total monthly costs (salaries, rent, admin, software, other) | 109,000 |
1. Specialist Utilization: How Full Is the Schedule?
Formula: booked sessions ÷ available session slots × 100.
Available slots are specialists × slots per day × working days. In the example: 6 × 6 × 22 = 792 slots. The center booked 713 sessions, so utilization is 713 ÷ 792 = 90%.
Where the data is: the appointment calendar. Count every session that was booked for the month, whatever happened to it afterwards.
Watch for:
- Utilization falling for two months in a row while the waiting list grows. That usually means a scheduling problem (specialists' free slots don't match the times families can come), not a demand problem.
- One specialist far below the others. Look at their caseload and discipline before drawing conclusions about performance.
What to do: list the empty slots by day and hour. If they cluster in mornings, that is where to put new intakes, assessments, or school-age children on holiday.
2. Attendance Rate: Do Booked Sessions Actually Happen?
Formula: sessions attended ÷ sessions booked × 100.
In the example, 642 of 713 booked sessions took place: 90% attendance. The 71 missed sessions are worth 71 × 200 = 14,200 units in a single month.
Where the data is: appointment statuses. This number only works if every appointment is closed with a status: completed, cancelled by the family, cancelled by the center, no-show, or rescheduled. If staff leave appointments open, you can't calculate it.
Watch for:
- No-shows and late cancellations from the same few families. Talk to them; the cause is often transport or a timing clash with school.
- Cancellations by the center. Those are lost revenue you control: specialist absence, poor leave planning, or double booking.
What to do: split missed sessions into "family" and "center" causes, then write a cancellation policy you actually apply: how much notice is needed, and when a session is deducted from the package.
3. Cost Per Delivered Session: Does Each Session Make Money?
Formula: total monthly costs ÷ sessions delivered.
In the example: 109,000 ÷ 642 = about 170 units per session, against an average price of 200. The center keeps about 30 units per session, roughly 15%.
This is the number that turns attendance into money. At this center, every missed session takes away 200 units of revenue while costs stay the same.
Your break-even point: total monthly costs ÷ average session price. In the example: 109,000 ÷ 200 = 545 delivered sessions. Below 545, the month loses money. This center delivered 642, so it had a margin of 97 sessions. Ten more missed sessions a week would wipe out about 40 of them.
Where the data is: your accounts for costs, and the attended sessions from number 2.
What to do: if the gap between cost and price is thin, attendance and utilization are usually cheaper to fix than raising prices. Our free therapy center profit calculator runs this calculation with your own costs and shows how much each point of attendance is worth.
4. Collection Rate: Does the Money Actually Arrive?
Formula: money collected in the month ÷ money invoiced in the month × 100.
In the example, the center invoiced 128,400 units and collected 115,600: a 90% collection rate. The center did the work, but 12,800 units are still sitting with families.
Where the data is: invoices and payments. If you sell packages paid upfront, compare packages sold with packages paid.
Watch for: a collection rate that is lower than your attendance rate. That means the center is losing more money after sessions than from missed sessions.
5. Overdue Balances: Who Owes What, and for How Long?
Formula: the total of unpaid invoices, grouped by age: under 30 days, 30 to 60 days, and over 60 days.
In the example, 18,500 units are more than 30 days overdue, owed by 9 families.
Where the data is: the list of unpaid invoices, with due dates.
Why it matters separately from number 4: the collection rate tells you about this month. Overdue balances tell you about the past. An old balance rarely shrinks by itself, and the longer it waits, the harder the conversation with the family gets.
What to do: review the over-30-day list every week. Agree on an installment plan early, and decide in your policy what happens to new bookings when a balance passes 60 days. Decide this once, write it down, and apply it the same way for every family.
6. Package Renewal Rate: Do Families Continue?
Formula: packages renewed ÷ packages that ended in the month × 100.
In the example, 15 packages ended last month and 11 families renewed: a 73% renewal rate. A further 14 packages end within the next 30 days.
Where the data is: package records with an end date or a remaining session balance.
Watch for:
- Families who find out their package has ended at the reception desk. That is an awkward moment and a common reason families drift away.
- Low renewals for one discipline or one specialist. The cause may be clinical (unclear progress) or practical (a timing that no longer suits the family).
What to do: every week, list packages with three or fewer sessions left. Contact those families before the last session, ideally with a short progress update from the specialist. A parent who can see what changed is far easier to renew than one who is only sent an invoice.
7. Net Change in Active Children: Is the Center Growing?
Formula: new children who started this month − children who left this month.
In the example, the center began the month with 58 active children, started 6 new ones, and lost 4. Net change: +2, ending at 60.
Where the data is: child records with start dates and discharge or exit dates. Count "active" the same way every month, for example any child with at least one session in the last 30 days.
Watch for: a positive number that hides a high exit count. Starting 10 and losing 8 isn't the same center as starting 3 and losing 1. Record why each child left: planned discharge (good), moved away (neutral), or dropped out (worth a phone call).
8. Overdue Documentation: Is Clinical Work Being Recorded?
Formula: session notes not written within your agreed time (for example 48 hours), plus progress reports past their due date.
In the example, 23 session notes are more than 48 hours old and 3 progress reports are overdue.
This is the only number on the list that isn't money, and that's deliberate. Late notes lose detail, late reports delay the conversations that drive renewals (number 6), and a file with gaps becomes a problem when a specialist leaves or a regulator visits.
Where the data is: a list of sessions without a note, and of progress reports by due date.
What to do: make it a team number, not a hunt for one person. If notes are always late, the cause is usually time: specialists booked back-to-back with no documentation time. Our guides to writing session notes and progress reports show formats that take less time to complete.
The Monthly Scorecard
Copy this table into a spreadsheet. Fill it in during the first week of each month, and keep the previous three months beside it.
| # | Number | Formula | Example | Your target |
|---|---|---|---|---|
| 1 | Specialist utilization | Booked ÷ available slots | 90% | |
| 2 | Attendance rate | Attended ÷ booked | 90% | |
| 3 | Cost per delivered session | Total costs ÷ delivered sessions | 170 (price 200) | |
| 4 | Collection rate | Collected ÷ invoiced | 90% | |
| 5 | Overdue balances | Unpaid over 30 days | 18,500 (9 families) | |
| 6 | Package renewal rate | Renewed ÷ ended | 73% | |
| 7 | Net change in active children | Started − left | +2 | |
| 8 | Overdue documentation | Late notes + overdue reports | 23 + 3 |
Set "your target" from your own history and your break-even point, not from a number you read somewhere. Then pick one number to improve next month. Trying to move all eight at once usually moves none of them.
Where Aghsan Fits
These numbers are only as good as the records behind them. In most centers, the data is spread across a calendar, a notebook of package cards, a WhatsApp group, and a spreadsheet someone rebuilds every month.
Aghsan keeps the records these eight numbers need in one system:
- Appointments with a status: appointments can be marked completed, cancelled, missed, or rescheduled, across specialists and rooms (numbers 1 and 2).
- Packages and invoices: billing tracks session packages, used and remaining sessions, expiry dates, payments, and unpaid or overdue invoices (numbers 4, 5, and 6).
- One file per child: child records link sessions, goals, and progress reports, so missing notes and overdue reports are easy to spot (numbers 7 and 8).
- Parents see progress: the parent portal shows families their own child's published progress, which helps when it's time to renew.
Want to see how much missed sessions and paperwork time cost your center? Start with the profit calculator, then try Aghsan with your own data.
Frequently asked questions
What are the most important KPIs for a therapy center?
Eight numbers cover most of what an owner needs each month: specialist utilization, attendance rate, cost per delivered session, collection rate, overdue balances, package renewal rate, net change in active children, and overdue documentation. Together they show whether the center is full, whether booked sessions happen, whether each session makes money, whether that money arrives, and whether families stay.
What is a good utilization rate for a therapy center?
There is no reliable published benchmark for therapy centers in the Gulf, Egypt, or Jordan, and any figure you see depends on how capacity is counted. Compare your own utilization month to month, and use your break-even point as the floor: the number of delivered sessions at which revenue covers all monthly costs.
How do I calculate cost per session in a therapy center?
Add up every monthly cost (salaries, rent, administration, software, and everything else) and divide by the number of sessions actually delivered that month. Compare the result with your average session price. If the gap is small, a few more missed sessions or one empty schedule can turn the month into a loss.
How often should a center owner review these numbers?
Once a month, in the first week, on the same day each month, using the same definitions every time. Three of the numbers (packages ending soon, overdue balances, and overdue documentation) are worth a quick weekly look, because they can be fixed before they cost money.
Do I need software to track therapy center KPIs?
No. A spreadsheet works if appointment statuses, invoices, and package balances are recorded consistently. Software helps when the data already lives in one place, so the numbers come from the records instead of being rebuilt by hand at the end of each month.